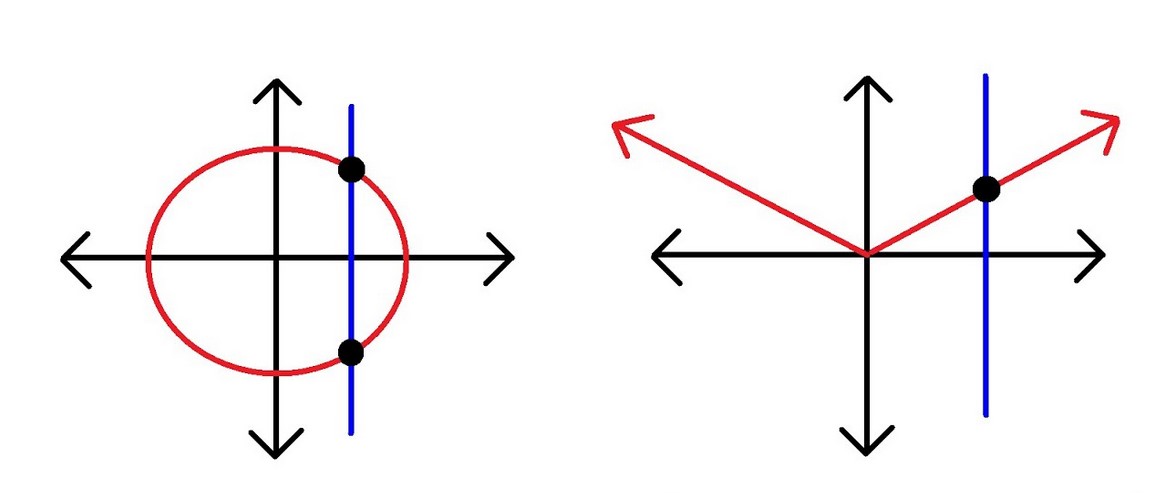
Following up on my post where I introduced the concept of functions, here I would like to provide you with a quick and easy test that you can perform on any graph which will help you decide if you are looking at the graph of a function or not. This check is called the vertical line test. It is simple to do, takes almost no time at all, and is guaranteed to be right! I will now explain the vertical line test definition.
First, you need to recall what exactly is meant by “function.” In my introductory post, I showed you how I was first taught this concept, by using the metaphor of a machine. You first start off with your input number, which you feed into the machine (which means, you perform the function calculation on it), and then the machine provides you the output when it has done its work. An important point about this metaphor is that every time you put in a specific starting number, the machine will always give you the same output number. An equally important point is that for every number that you give your machine, not only does it give you the same answer each time, it gives you only a single output number. So, for example, if you feed the function an input value of 2, every time you do the calculation, you will always get a 10 and only a 10. This is a property of functions. If your calculation gives you more than one output value, then there are two options – either you made a mistake, or you are not dealing with a function at all! This is where the vertical line test comes in handy.
So then, let’s begin to relate this concept to a graph. When I talk about providing a number for our machine, I am referring to providing a value for x to our function f(x). The machine/function then produces an output, corresponding to the value of f(x) at x – though, for this comparison, it may be easier to just think of the output as a y-value. So, if we input an x-value, and get out a y-value to correspond with that x, we have determined an ordered pair coordinate! And as I stated above, our machine/function will produce only a single result for every value of x that you provide it.

The vertical line test definition is a check to see that your graph only has a single y-value for every x-value in its domain. To do this, all you need to do is scan over all of the x-values on your graph and make sure that there are no more than one y-value for each. To easily accomplish this, all you need to do is take your pencil, line it up vertically against your graph, and then move it from side to side, making sure that the pencil is never touching the line at more than one point at a time. The vertical line test is just that easy! If your pencil only ever crosses your curve at one point at a time, you have a function. As a very common example of what is NOT a function, consider a circle and notice how it fails this test.
And that’s all there is to know about the vertical line test. Now you are armed with the knowledge to be able to simply look at a graph and decide whether it is a function or not! For a couple of vertical line test worksheets, check out this page over at Math Warehouse.

